Petrochemical Market Review
March 2025
A Crucial Insight into Global Fertilizer Trends, Providing Key Knowledge for Industry Professionals
Executive Summary
March 2025 witnessed a complex and dynamic fertilizer market shaped by energy cost fluctuations, geopolitical developments, seasonal demand, and policy shifts such as CBAM implementation in Europe. Across global regions, fertilizer pricing and trade conditions fluctuated significantly, reflecting both macroeconomic pressures and regional production adjustments.
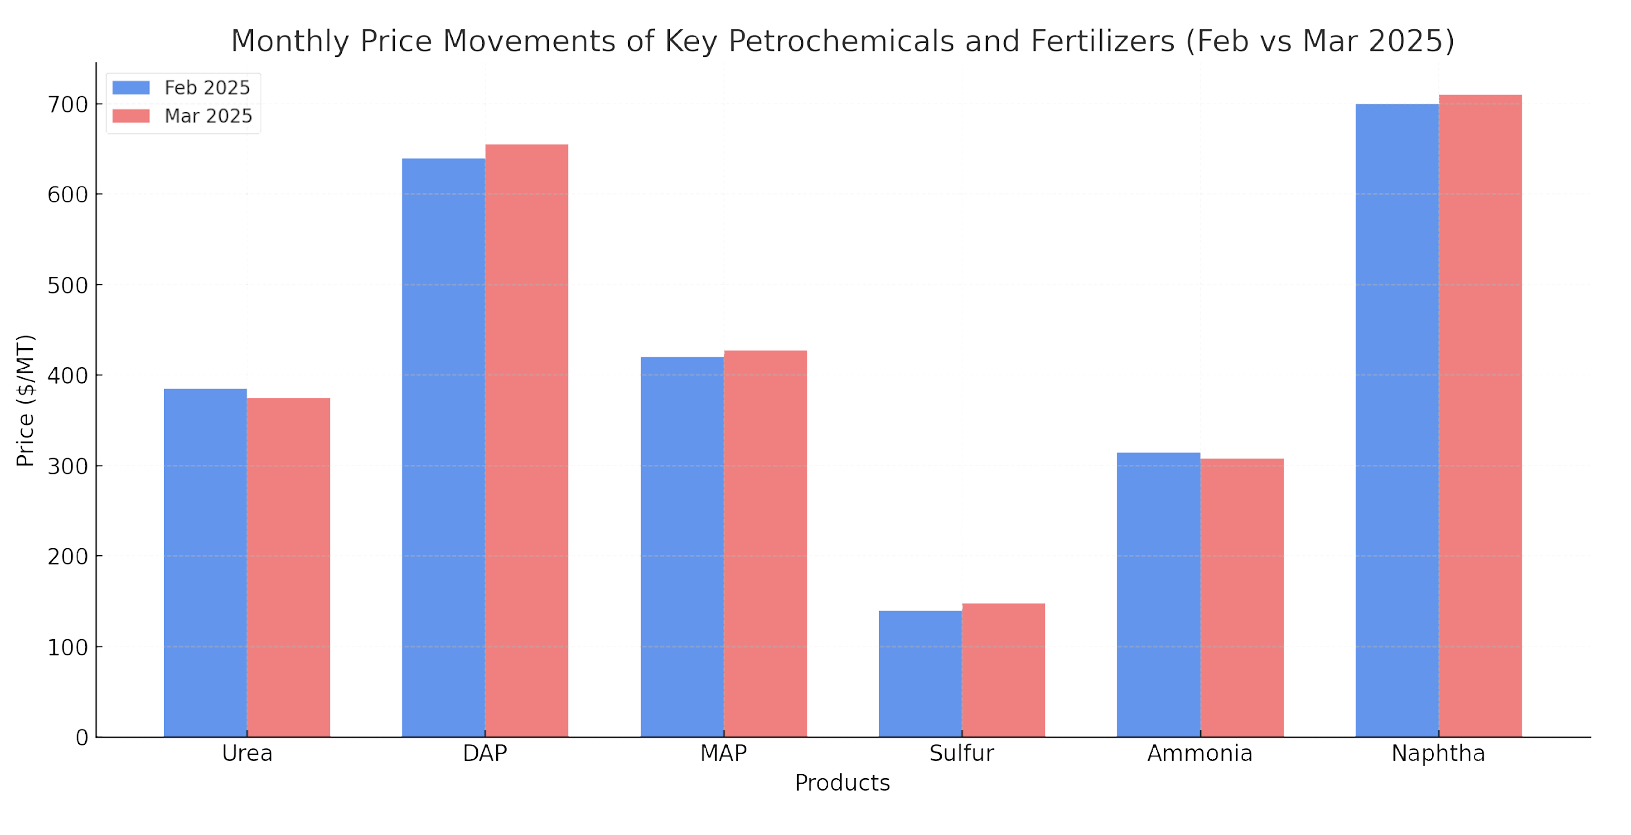
| Product | Feb 2025 Price | Mar 2025 Price | Change (USD) | % Change |
|---|---|---|---|---|
| Urea | 385 USD/MT | 375 USD/MT | -10 | -2.6% |
| DAP | 640 USD/MT | 655 USD/MT | +15 | +2.3% |
| MAP | 420 USD/MT | 428 USD/MT | +8 | +1.9% |
| Sulfur | 140 USD/MT | 148 USD/MT | +8 | +5.7% |
| Ammonia | 315 USD/MT | 308 USD/MT | -7 | -2.2% |
| Naphtha | 700 USD/MT | 710 USD/MT | +10 | +1.4% |
Key Highlights by Segment:
| Segment | Price Trend | Market Driver | Outlook |
|---|---|---|---|
| Nitrogen (Urea, Ammonia, AN) | 🔽 Softening | Higher supply from Iran reduced India's demand | Stabilizing in April |
| Phosphates (DAP, MAP, TSP) | 🔼 Slight Increase | Limited Chinese exports, strong Brazilian buying | Tight supply persists |
| Potash (MOP) | ➡️ Stable | India contract awaited, balanced supply | Neutral to firm |
| Sulfur & Sulfuric Acid | 🔼 Firming | Strong demand from China and Indonesia | Upward pressure |
| NPKs (blends & compounds) | ➡️ Stable to soft | Raw material prices mixed | Mixed trajectory |
Regional Market Overview:
- Middle East & Persian Gulf: Iranian producers increased urea exports after gas disruptions eased; FOB prices softened. Ammonia exports from the Gulf remained weak due to lower spot interest.
- China: Export restrictions continued for phosphates, especially DAP and MAP. Domestic demand ahead of spring planting limited international availability.
- India: Urea imports slowed in March, contributing to global downward pressure on FOB values. NPK and phosphate imports remained stable, with new tenders expected in April.
- Southeast Asia: Indonesia and the Philippines showed stronger NPK and urea demand. Freight constraints eased, improving trade flows.
- Africa (West & East): Ghana, Nigeria, and Kenya maintained moderate import levels. Tender activity is expected to increase in Q2, especially for urea and compound fertilizers.
- Europe: CBAM-related compliance preparation began affecting import strategies. Ammonium nitrate and green ammonia alternatives gained attention.
Key Themes This Month:
Iran Returns to Market, CBAM Readiness, Freight Rate Stabilization, Green Transition Signals
- Iran Returns to Market: After February’s supply issues, Iran resumed stable urea exports, easing FOB values.
- CBAM Readiness: Exporters to the EU intensified documentation and carbon auditing, raising operational costs.
- Freight Rate Stabilization: Maritime freight for bulk fertilizers showed fewer disruptions than in previous months.
- Green Transition Signals: Ammonia market discussions increasingly revolved around green and blue production routes.
Global Fertilizer Price Movements (February vs. March 2025)
Fertilizer markets across key regions exhibited mixed trends in March 2025, reflecting a complex interplay of supply-side disruptions, regional demand cycles, freight market fluctuations, and shifting trade flows. While prices for some products saw modest gains due to tightening inventories or strong seasonal demand, others declined amid softer spot market activity or improved supply availability.
The following table summarizes average FOB and CIF prices for key fertilizer products across major regions in March compared to February 2025:
| Product | Region | Feb 2025 Price (USD/MT) | Mar 2025 Price (USD/MT) | Change (USD) | % Change |
|---|---|---|---|---|---|
| Granular Urea | Middle East (FOB) | 385 | 375 | -10 | -2.6% |
| Granular Urea | SE Asia (CIF) | 430 | 415 | -15 | -3.5% |
| Granular Urea | West Africa (CIF) | 445 | 435 | -10 | -2.2% |
| DAP | India (CFR) | 636 | 655 | +19 | +3.0% |
| DAP | NW Europe (CFR) | 662 | 670 | +8 | +1.2% |
| MAP | Brazil (CFR) | 420 | 428 | +8 | +1.9% |
| Ammonia (Anhydrous) | MEG (FOB) | 315 | 308 | -7 | -2.2% |
| Ammonium Sulfate | China (FOB) | 140 | 145 | +5 | +3.6% |
| NPK (15-15-15) | West Africa (CIF) | 490 | 495 | +5 | +1.0% |
Regional Insights
Middle East & Persian Gulf
- Granular urea FOB prices softened to 375 USD/MT, primarily due to restored Iranian production and improved supply from Pardis and Shiraz.
- Ammonia values dipped slightly as ample inventories and reduced European import demand weighed on MEG (Middle East Gulf) pricing.
India & Southeast Asia
- Indian DAP prices rose to 655 USD/MT CFR, supported by limited Chinese exports and pre-monsoon procurement.
- Southeast Asian urea demand slowed, pushing prices to
415 USD/MT CIF, though traders anticipate a rebound with the upcoming Indian tender in April.
China
- Export restrictions remained tight for DAP/MAP, but some spot transactions emerged at higher values.
- Ammonium sulfate FOB prices increased, reaching 145 USD/MT, driven by active inquiries from Indonesia and Latin America.
Africa (West & Sub-Saharan)
- NPK 15-15-15 demand continued from West African buyers, with CIF prices stabilizing around 495 USD/MT.
- Urea CIF offers dropped to 435 USD/MT, although low port infrastructure efficiency slowed off-take.
Europe
- European markets witnessed a marginal uptick in MAP and DAP, with MAP at 428 USD/MT and DAP at 670 USD/MT CFR NW Europe, due to lower stocks and the effect of upcoming CBAM compliance costs.
- Ammonia imports into Europe remain subdued, reflecting high energy costs and increasing preference for low-carbon alternatives.
Price Trend Visualization
The following chart provides a comparative visual of price movements for key fertilizers:
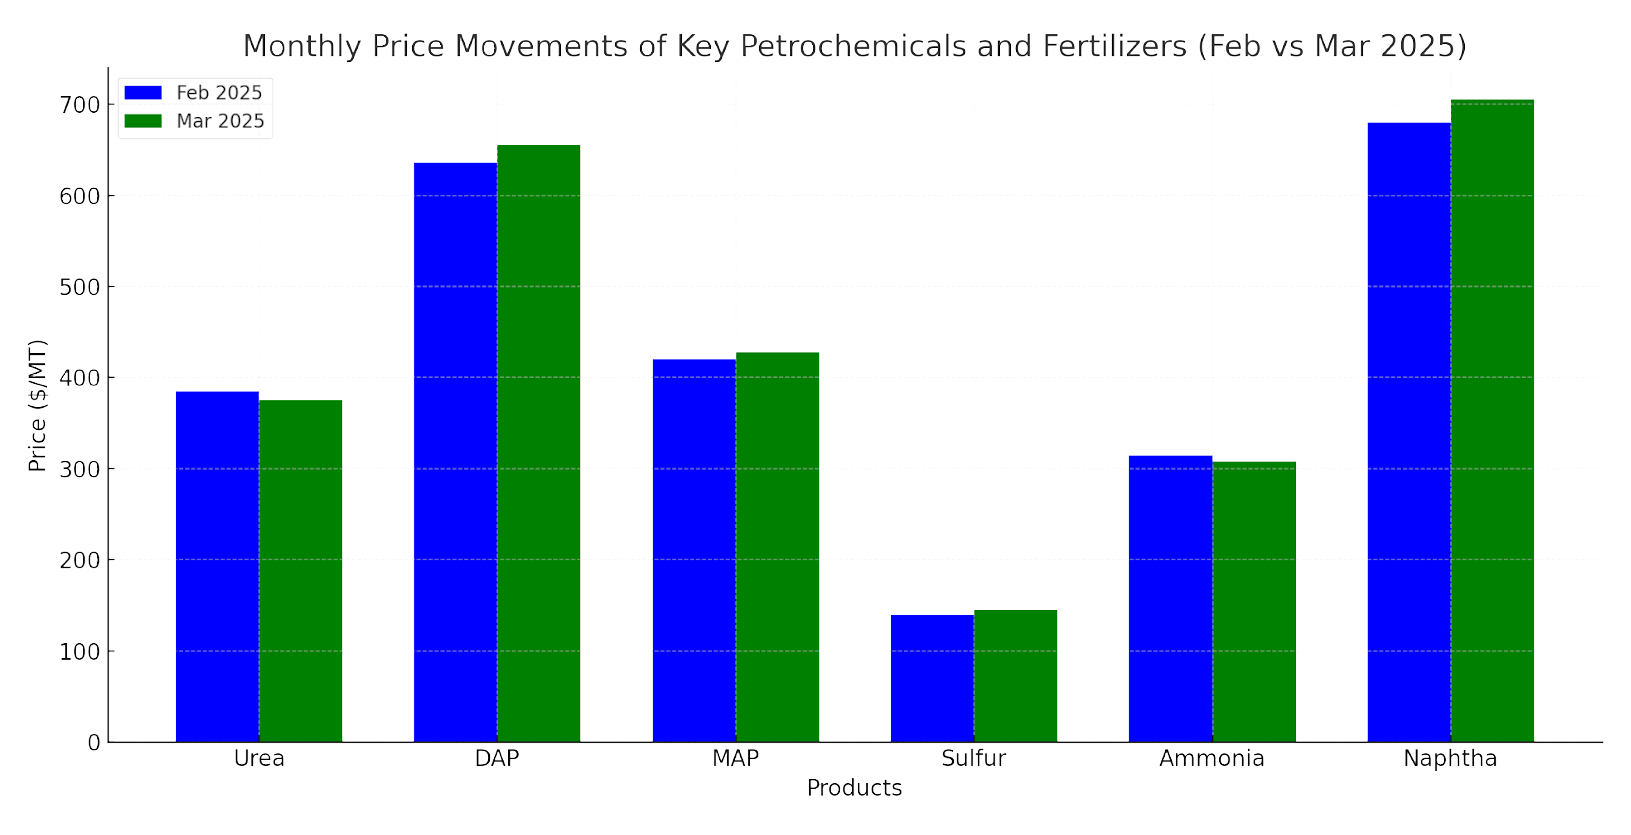
Note: The chart includes price changes for urea, DAP, MAP, sulfur, ammonia, and naphtha.
Regional Market Dynamics - March 2025
📌 Middle East & Persian Gulf
The Middle East, particularly Iran and Qatar, saw a modest urea and ammonia production recovery due to improved gas availability compared to early February.
- Urea: Iranian producers such as Pardis and Shiraz resumed operations near full capacity. FOB prices hovered in the mid-380 USD/MT, with some March-April lots offered at 385.30 USD/MT FOB, slightly up from February.
- Ammonia: Prices in the Persian Gulf slightly decreased to 310–320 USD/MT FOB, impacted by oversupply and weak downstream demand. However, March bids picked up by the end of the month.
- Sulfur: Continued strong demand from China and Indonesia drove FOB Iran sulfur prices to 135–145 MT/MT, with CFR China breaking the 200 USD/MT barrier, up from February’s levels.
Export logistics remained stable, and Iranian material flowed toward key Southeast Asia and Africa markets. However, the region remains sensitive to political and logistical constraints, including international sanctions and port congestion.
📌 China
Due to domestic supply management policies, China continued to limit phosphate exports, with DAP/MAP volumes tightly controlled.
- DAP: Prices remained firm domestically at 620–630 USD/MT FOB for May loading. Limited export availability led to tighter global supply.
- MAP: Prices stayed around 410–420 USD/MT, though actual export volumes were marginal.
- Sulfur: Imports surged, pushing prices to 200–210 USD/MT CFR, driven by restocking ahead of anticipated fertilizer production increases.
- Urea: China did not aggressively export urea in March, preferring to maintain domestic inventories.
Policy uncertainty remains a significant factor influencing the region’s fertilizer trade, and a possible export easing in Q2 2025 is under review.
📌 South & Southeast Asia
India:
India remained quiet in the global urea market, with delayed tender activity expected to resume in early Q2. However, urea importers kept close tabs on Iranian and Southeast Asian FOB offers.
- Urea: Indian demand is expected to resume vigorously in April. Importers monitored Pardis and Kaltim offers in the mid-to-high 380 USD/MT FOB.
- DAP: The CFR price stood at 636 USD/MT, marginally up from February. This was supported by tight global supply and China’s restricted exports.
- Ammonium Sulfate (AS): Prices remained subdued due to limited Indian demand and congestion concerns on inland transport.
Southeast Asia (Indonesia, Vietnam, Philippines):
Southeast Asia was active in March, particularly Indonesia.
- Indonesia’s Kaltim awarded tenders at 410 USD/MT FOB Bontang, with suppliers targeting 430 USD/MT FOB for future lots.
- Vietnam CFR levels stood at 415–420 USD/MT, though buyers resisted higher levels.
Overall, the region faced high CIF prices due to increased freight rates and constrained supply from traditional sources like China and Iran.
📌 Africa
Africa, particularly West Africa, showed stronger engagement in March, focusing on pre-season procurement.
- Nigeria & Ghana: Traders reported interest in Iranian urea and North African phosphates. However, logistical issues—particularly at Nigerian ports—delayed some offloading.
- Togo & Côte d’Ivoire: Continued import demand for NPK (15-15-15) and urea, especially from Moroccan and Iranian sources.
- East Africa: Kenya and Ethiopia reported steady DAP imports, with Ethiopia’s government-led tenders securing significant volumes at elevated prices (636–645 USD/MT CFR).
Africa’s growing demand remains vital for exporters. However, infrastructure and financing constraints continue to hamper large-scale trade flows.
📌 Europe
Europe’s fertilizer market was heavily influenced by environmental compliance and CBAM-related adjustments.
- Ammonia: Prices declined to 310–320 USD/MT FOB, due to low seasonal consumption and increased imports from North Africa and the US.
- DAP: CFR NW Europe price rose to 662 USD/MT, mainly due to tight supply and the rising carbon cost impact on production.
- Sulfuric Acid: Prices remained low (145–150 USD/MT CFR), driven by weak demand and oversupply from East Asia.
CBAM reporting requirements continued to pressure importers to seek low-carbon fertilizers, increasing interest in green ammonia and enhanced efficiency fertilizers (EEFs).
📌 Latin America
Brazil and Argentina were active buyers, particularly of urea and phosphates.
- Urea: CFR Brazil prices settled at 420–425 USD/MT, slightly down due to better availability and softening freight rates.
- MAP: Prices held steady at 420–430 USD/MT CFR, with moderate pre-season purchasing.
- Potash: Demand for MOP remained stable. Prices for Russian-origin MOP were competitive at 290–310 USD/MT CFR, supported by increased availability.
Although buyers showed caution due to currency volatility and freight risks, regional demand was robust ahead of the planting season.
Key Market Drivers and Influencing Factors
March 2025 witnessed dynamic shifts globally across fertilizer markets, shaped by economic, geopolitical, logistical, and regulatory influences. Below is a comprehensive breakdown of the most significant drivers impacting fertilizer production, trade, and pricing this month:
🔥 Energy Prices and Feedstock Availability
Natural gas and ammonia feedstock prices fluctuated globally, exerting pressure on nitrogen fertilizer producers.
- Europe: Natural gas prices remained relatively high, discouraging domestic ammonia and urea production. Several producers operated below capacity, contributing to import reliance.
- Middle East & Iran: The gas supply returned to normal after February disruptions, allowing Iranian plants like Pardis and Shiraz to resume production. This stabilized FOB urea offers in the mid-$380s/t.
- Asia: In Southeast Asia, particularly Indonesia and Malaysia, stable gas supplies allowed Kaltim and Petronas to issue tenders regularly, though rising costs kept offers above 410 USD/MT FOB.
🧪 Impact: Gas-driven production costs keep ammonia and urea prices firm, especially in regions without subsidized energy inputs.
🌍 Geopolitical Tensions and Sanctions
Geopolitical instability continued to impact fertilizer flows:
- Russia & Belarus: Potash and ammonia exports remained active but under tight scrutiny due to ongoing sanctions. Some European buyers sought alternative origins due to CBAM compliance concerns.
- Iran: Despite sanctions, Iranian fertilizer producers continued active exports, primarily to Asia and Africa, thanks to FOB discounts and strategic trading alliances.
- Ukraine Conflict: Black Sea logistics remained constrained, affecting regional ammonia and urea trade.
📉 Impact: Market participants continued diversifying sourcing strategies and preferred origin flexibility in contracts to mitigate political risk.
🚢 Freight Market Volatility
Freight rates experienced slight relief in March but remained high on specific long-haul routes:
- CFR China & Southeast Asia: Freight for granular urea and NPK from the Middle East stayed in the 35–45 USD/MT range.
- Africa-bound cargoes (especially West Africa): Higher insurance premiums and port delays kept rates firm, averaging 60–70 USD/MT from North Africa and the Middle East.
- Latin America: CIF costs from North Africa to Brazil moderated due to improved vessel availability.
📦 Impact: Freight continues to influence significantly landed fertilizer costs. Buyers in distant or infrastructure-challenged regions (e.g., West Africa, South Asia) face elevated CIF prices.
🧑🌾 Seasonal Demand Patterns
March saw vigorous seasonal buying activity across several regions:
- Brazil: Buyers accelerated urea and MAP purchases before the primary planting season. CFR prices stabilized at 420–430 USD/MT for urea and 430 USD/MT for MAP.
- India: Although India did not tender in March, expectations for April procurement kept the market cautious and speculative.
- Africa: Pre-season fertilizer demand rose in Nigeria, Ghana, and Togo, with NPK blends and urea dominating import interest.
📈 Impact: Anticipatory buying ahead of peak planting seasons added upward pressure on prices in specific regional markets.
♻️ Regulatory Pressures: CBAM & Environmental Standards
The EU’s Carbon Border Adjustment Mechanism (CBAM) continued to reshape fertilizer trade flows:
- CBAM Reporting Phase (2025): Fertilizer exporters to the EU are required to submit verified carbon emissions reports. Those unable to comply face exclusion or financial penalties starting in 2026.
- Low-carbon fertilizers: Growing preference in Europe and parts of Asia for green ammonia, enhanced efficiency fertilizers (EEFs), and bio-based fertilizers.
- Exporters’ Response: Countries like Egypt, Morocco, and Malaysia are investing in carbon auditing systems and green production capacities.
⚖️ Impact: Exporters with high-carbon fertilizers (especially coal-based urea/ammonia from Asia) face rising compliance costs and possible loss of EU market share.
📊 Supply Chain Constraints and Infrastructure
- China: Ongoing restrictions on phosphate exports (DAP/MAP) and limited global availability lead to price hikes in India and Southeast Asia.
- Africa: Port delays and limited bagging infrastructure in West Africa affected fertilizer availability and increased demurrage costs.
- Europe: Logistics normalized post-winter, but port congestion remains a concern for bulk shipments in Northwest Europe.
🚧 Impact: Regional infrastructure and export controls significantly influenced March delivery timelines and supplier selection.
💰 Currency & Financial Markets
- Stronger USD: The US dollar remained strong in March, which increased import costs in emerging markets, particularly in Africa and South Asia.
- Trade Financing: Volatility in FX markets affected buyers’ ability to secure letters of credit (LCs), with a growing preference for staggered payment terms (e.g., 20/80 MT103 structures).
💲 Impact: Currency risk and financial constraints reduced some buyers’ purchasing capacity or delayed tenders.
🧪 Raw Material & By-product Market Trends
- Sulfur: Prices continued to rise globally, with CFR China exceeding 200 USD/MT. Iran and Qatar emerged as key suppliers to Asia.
- Sulfuric Acid: Weak downstream demand (e.g., copper and zinc industries) kept prices low at 145–150 USD/MT CFR Chile.
- Ammonium Sulfate: Prices softened due to low demand in India and sluggish barge movements in the US Gulf.
⚗️ Impact: Input material price shifts affected the cost structure for DAP/MAP and compound fertilizers globally.
Urea Market Deep Dive - March 2025
Urea markets experienced notable price fluctuations and regional demand shifts in March 2025, influenced by production rebounds, tender speculation, and freight challenges. While sentiment remained cautiously firm in the first half of the month, prices showed signs of softening by the end as the global market adjusted to returning supply from key exporters like Iran and seasonal slowdowns in select regions.
Price Overview
| Region | Price Range (FOB/CFR) | Change vs. Feb | Notes |
|---|---|---|---|
| Iran (FOB) | 385–390 USD/MT | ▲ +5 USD | Output resumed at Pardis & Shiraz; stable demand from Turkey, Brazil, and Africa. |
| SE Asia (FOB) | 405–430 USD/MT | ▲ +10 USD | Kaltim’s tender attracted strong bids; supplier targets firm pricing. |
| China (FOB) | 355–370 USD/MT (domestic only) | - | Exports still restricted; traders expect partial easing in Q2. |
| Egypt (FOB) | 435–445 USD/MT | ▲ +10 USD | Tight supply; strong demand from Europe & Brazil. |
| Brazil (CFR) | 420–425 USD/MT | ▼ -5 USD | Slower buying pace; buyers cautious amid currency risks. |
| West Africa (CFR) | 440–455 USD/MT | ▲ +10 USD | Demand surging for pre-season deliveries in Nigeria, Ghana, and Togo. |
| India (CFR) | N/A | - | No tender issued in March; the market is watching for the early April tender. |
Regional Market Highlights
Iran
- Production: Resumed after February gas disruptions. Pardis and Shiraz ramped up operations, restoring 600,000+ MT/month capacity.
- Trade: Pardis sold two 30,000MT lots FOB in the mid-380 USD/MT range. The market is targeting 390 USD/MT.
- Demand: Strong inquiries from Turkey, Brazil, and East Africa supported price stability.
Brazil
- Sentiment: Buyers are hesitant due to uncertain FX rates and falling CFR prices.
- Imports: They were reduced compared to February but remained stable. Traders expect larger volumes in April for the winter corn season.
- Price: Softened slightly to 420–425 USD/MT CFR by late March.
India
- No Tender Issued: While India did not issue a urea tender in March, the market anticipates MMTC or RCF will float one in early April.
- Impact: Lack of Indian demand reduced upward pressure on global prices but created uncertainty that kept traders alert.
China
- Export Controls Remain: No change in phosphate or urea export restrictions. Domestic prices remained firm.
- Traders’ Outlook: Market participants expect gradual export normalization post-Q2 2025.
Southeast Asia
- Indonesia (Kaltim): The March tender closed at 410 USD/MT FOB Bontang. The seller targets 430 USD/MT.
- Malaysia & Vietnam: Limited domestic production prompted modest imports from the Middle East.
Egypt
- Supply: Tighter domestic supply supported firm offers.
- Pricing: FOB offers increased to 435–445 USD/MT amid strong EU and LatAm demand.
Freight & Logistics
- FOB Iran remained attractive due to production recovery, but freight rates to Africa and Southeast Asia rose slightly.
- West Africa-bound cargoes experienced higher insurance premiums and port delays, pushing CFR offers above 450 USD/MT.
- Turkey & UAE transshipments continued to serve as significant channels for Iranian urea.
Market Sentiment
| Factor | Impact |
|---|---|
| India’s delayed tender | ⚖️ Neutral – market stable but alert. |
| Iran’s resumed production | 📈 Bullish – supporting FOB availability. |
| Freight pressure in Africa | 📈 Bullish – increasing delivered costs. |
| Softer demand in Brazil | 📉 Slightly Bearish – reduced short-term upside. |
| China’s ongoing restrictions | 📈 Bullish – supporting global tightness. |
Outlook for April 2025
- Indian Tender Anticipation: A significant price determinant in April. If floated, it could trigger a short-term price rebound.
- Supply Normalization: With Iranian production stabilized and Kaltim expected to export actively, FOB prices may face downward pressure if Indian demand delays.
- Buyer Strategy: Buyers may delay large purchases, anticipating softer offers, unless freight or geopolitical disruptions escalate.
Phosphate Market Analysis - March 2025
The global phosphate fertilizer market remained relatively firm in March 2025, with prices for Diammonium Phosphate (DAP) and Monoammonium Phosphate (MAP) holding steady or rising slightly in most regions. Export constraints from China, increased demand from India and Africa, and tighter supplies from Russia and the U.S. continue to shape the global trade environment.
Phosphate Price Summary – March 2025
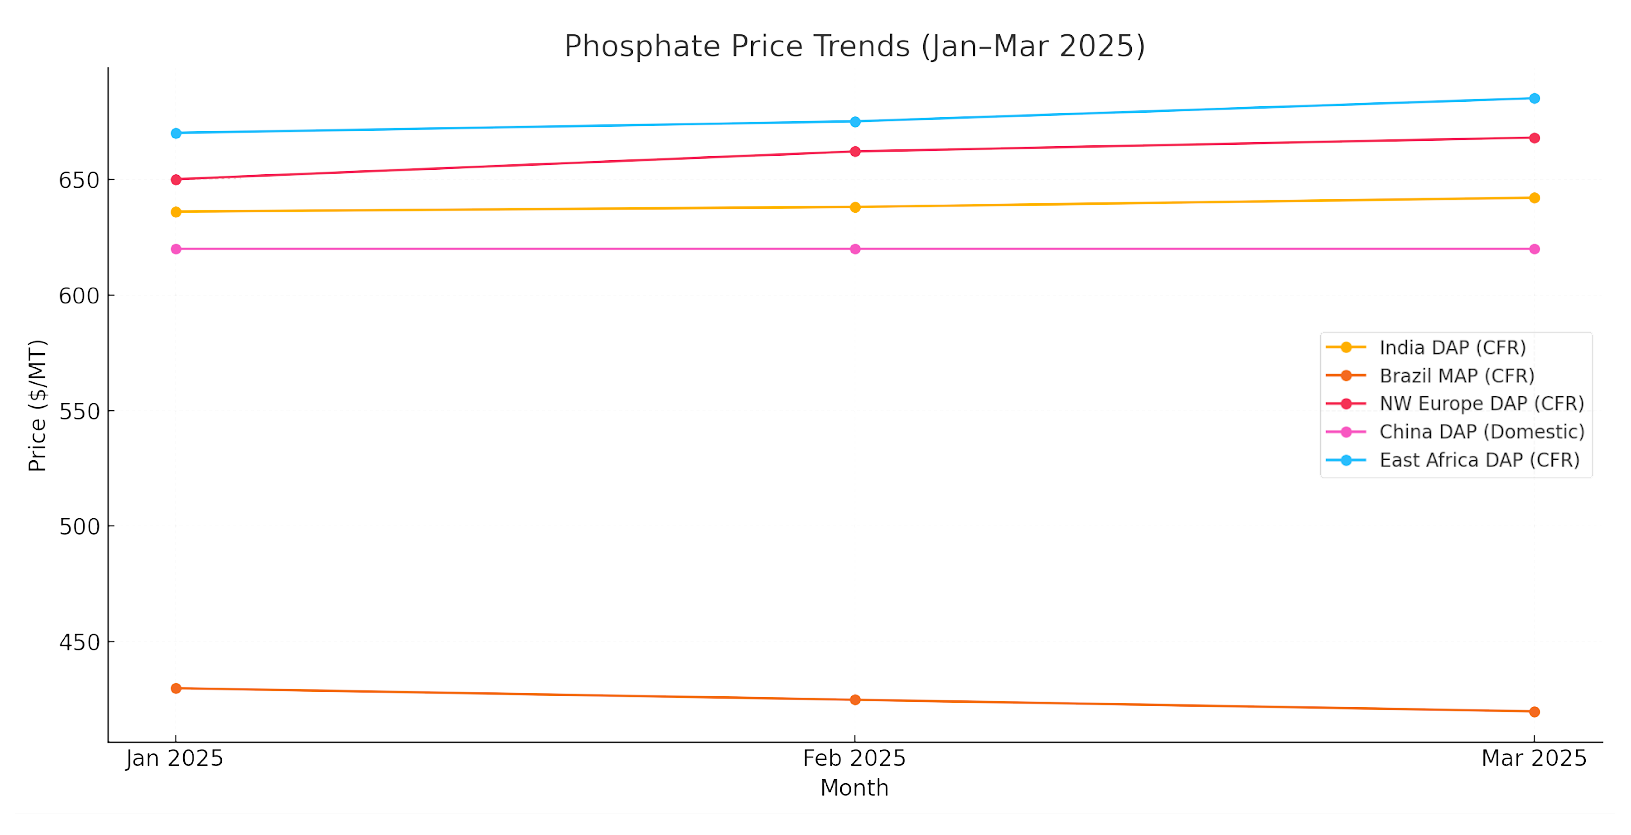
| Region | Product | Price Range (USD/MT) | Change vs. Feb | Notes |
|---|---|---|---|---|
| India (CFR) | DAP | 638–642 | ▲ +2–6 USD | Increased buying interest; limited supply. |
| Brazil (CFR) | MAP | 420–425 | ▼ –5 USD | Lower seasonal demand; steady inventory. |
| NW Europe (CFR) | DAP | 664–668 | ▲ +2–4 USD | Higher due to CBAM-related adjustments. |
| China (Domestic) | DAP | 620 (FOB restricted) | - | Exports still blocked; domestic price steady. |
| East Africa (CFR) | DAP | 675–685 | ▲ +5–10 USD | High demand ahead of the planting season. |
| Russia (FOB Black Sea) | DAP | 585–600 | ▼ –5 USD | Supply remains constrained due to sanctions and logistics issues. |
Regional Market Highlights
India
- Import Activity: India saw strong demand for DAP during March, which was supported by preparations for the Kharif season.
- Price Support: FOB China offers remained unavailable, pushing Indian buyers to source from North Africa and the Middle East.
- Tenders: No major government tender in March, but private sector buying was active.
Brazil
- Demand Softness: The MAP market in Brazil saw mild pressure due to reduced imports and slower consumption.
- Pricing: MAP prices hovered around 420–425 USD/MT CFR; traders expect stabilization or a slight uptick by April.
China
- Export Ban Continues: The government restricted DAP exports to safeguard the domestic supply.
- Impact: Limited Chinese participation supported prices globally, especially in Asia and Africa.
Europe
- CBAM Adjustments: Buyers focused on carbon-efficient phosphate sources; demand for Moroccan and Jordanian DAP grew.
- Prices: DAP CFR NW Europe rose slightly to 665 USD/MT on average, factoring in environmental compliance costs.
East Africa
- Strong Demand: Kenya, Tanzania, and Ethiopia boosted imports before planting.
- Price Sensitivity: Despite higher CFR prices, governments prioritized supply security amid food security initiatives.
Supply Chain & Production Insights
| Supplier Region | Highlights |
|---|---|
| Morocco (OCP) | Increased output and shipments, leading supplier to India and West Africa. |
| Russia | Exportable surplus exists but is limited by logistics bottlenecks. |
| US (Mosaic) | Stable production; prices firm amid strong domestic demand. |
| North Africa (Tunisia, Egypt) | Stable production, filling supply gaps left by China’s absence. |
Market Drivers in March 2025
| Driver | Impact |
|---|---|
| China’s continued export restrictions | 📈 Bullish |
| Indian seasonal demand | 📈 Bullish |
| Softer MAP demand in Brazil | 📉 Slightly Bearish |
| CBAM-related carbon cost adjustments | 📈 Bullish for low-emission exporters |
| Geopolitical limits on Russian exports | 📈 Bullish |
Outlook for April 2025
- India: Increased imports through tenders or private purchases could be seen.
- China: Any export policy easing would influence April and May trade flows.
- Brazil: Expected to restock MAP in late April–early May.
- Africa: Continued demand may elevate East and West Africa CFR prices.
- CBAM: Environmental regulations in the EU continue to shape sourcing strategies.
Phosphate Market Trend Chart
Sulfur, Ammonia, and Ammonium Sulfate (Amsul) Market Trends – March 2025
Sulfur Market Overview
In March 2025, sulfur prices continued their upward trajectory across global markets, driven by tight supply, strong phosphate fertilizer production, and increasing import demand from Asia.
Key Regional Highlights:
- FOB Middle East: Prices climbed to 145–150 USD/MT, up from 135–140 USD/MT in February, driven by sustained demand from China and India.
- CFR China: Moved past the 200 USD/MT threshold, touching 208–215 USD/MT, breaking through psychological resistance levels. Inventories in Chinese ports dropped below 2 million tons, supporting bullish sentiment.
- Indonesia & India: Strong demand from phosphate producers and metals industries pushed CFR prices into the low-mid 200 USD/MT.
- Qatar & Iran: Sulfur prices in Qatar surged to 202–207 USD/MT FOB, while FOB Iran values increased to 135–145 USD/MT, up by 10–15 USD/MT compared to last month.
Overall, sulfur markets remained tight with
congestion at export terminals, particularly in the Middle East, and
limited spot availability, especially for granular sulfur.
Ammonia Market Overview
The ammonia market was marked by regional divergence and price correction in March, with the Middle East and North Africa (MENA) showing a drop in FOB prices due to weak downstream demand.
Regional Highlights:
- FOB Middle East: Prices declined to 310–320 USD/MT, down from 340–350 USD/MT in February. Turkey and North Africa buyers resisted higher offers, forcing producers to revise prices downward.
- CFR Turkey: Slipped to low 500 USD/MT, with spot cargo reports concluding below 500 USD/MT as traders sought to clear inventory.
- India and Southeast Asia: Demand remained subdued due to competitive urea pricing, which impacted ammonia consumption in downstream blending.
- Trammo-OCP Deal: A 25,000 MT cargo was reportedly sold to OCP (Morocco) at 459 USD/MT CFR, representing a 76 USD/MT decline from early February levels.
Global ammonia trade is adjusting to CBAM reporting requirements and growing expectations for
green ammonia development in the second half of 2025.
Ammonium Sulfate (Amsul) Market Overview
Amsul prices showed a softening trend in March 2025, particularly in the US and Latin America, while Asian markets remained relatively stable.
Key Market Movements:
- FOB China (Capro & Standard Grades): Prices held in the 115–120 USD/MT range, with a slight decrease of 2–3 USD/MT due to weak Southeast Asian interest.
- CFR Brazil: Traded at 145–150 USD/MT, with buyers cautious amid uncertainty around freight costs and Indian tender schedules.
- US Gulf (NOLA): Barge prices dropped to 390 USD/st FOB, down from 395–400 USD/st in February, reflecting increased inventory and river logistics delays.
- Indian Demand: Remained muted as the much-anticipated Amsul tender had not been announced by the end of March, limiting spot trading activity.
Market Outlook & Strategic Insights
- Sulfur: Expected to remain firm in Q2 2025 due to steady phosphate demand, port congestion in the Middle East, and tight global supply.
- Ammonia: Prices may see further correction unless industrial demand improves; focus will remain on North African and Asian buying.
- Amsul: Stability may return with the Indian tender announcement in April, while Chinese export quotas and domestic demand will continue to influence supply chains.
Broader Petrochemical Context – March 2025
The global petrochemical landscape in March 2025 exhibited mixed trends as regional imbalances, crude oil volatility, and geopolitical factors continued to shape pricing, supply chains, and downstream demand across the sector. While specific segments like naphtha and marine fuels experienced moderate price recovery, others such as LPG and methanol remained under pressure due to weak seasonal demand and high inventory levels.
Crude Oil & Energy Market Landscape
Brent crude futures hovered in the $81–84/barrel range throughout March, showing mild fluctuations driven by mixed signals from macroeconomic data, OPEC+ production adjustments, and geopolitical risks in the Red Sea and Eastern Europe.
- Geopolitical Hotspots: Ongoing Red Sea trade corridor disruptions, triggered by maritime security concerns, have continued to impact shipping flows and delivery timelines for feedstock cargos.
- Refinery Operations: Maintenance season in Asia (particularly South Korea, India, and China) contributed to limited throughput, affecting naphtha and LPG balances.
Naphtha Market Trends
The naphtha market moderately rebounded during March 2025 after a soft February, supported by strong gasoline blending demand and improving cracker margins in parts of East Asia.
- FOB Persian Gulf: Naphtha prices increased slightly to 625–630 USD/MT, up by 10 USD/MT from February, helped by steady exports to East Asia and India.
- CFR Japan: Prices stabilized near 650–660 USD/MT, as petrochemical crackers returned from turnaround.
- Demand Outlook: Asian ethylene producers cautiously resumed operations, driving moderate restocking of feedstock inventories.
Overall sentiment is cautiously optimistic as inventory levels across Asia decline and crack margins improve, particularly in South Korea and Taiwan.
LPG (Liquefied Petroleum Gas)
In March, the LPG market remained bearish, underpinned by weak heating demand, high East Asian inventory, and subdued petrochemical demand for propane and butane.
- FOB Arab Gulf (Propane): Dropped to 565 USD/MT, down from 585 USD/MT in February.
- CFR North Asia: Propane fell to 592 USD/MT, while butane slipped to 574 USD/MT, with propane-butane parity remaining tight.
- Inventory Levels: Chinese ports reported near-record storage levels, pushing importers to defer or resell April delivery cargoes.
Traders anticipate a gradual recovery in Q2 as summer cooling and petrochemical usage pick up.
Methanol Market Overview
Methanol prices softened further amid oversupply and low derivative demand in China and Southeast Asia.
- FOB Iran: Remained under pressure at 240–250 USD/MT, with limited export volumes due to logistical constraints.
- CFR China: Fell below 270 USD/MT, reaching one-year lows.
- Downstream Impact: Weak demand from formaldehyde and acetic acid producers continued to weigh on sentiment.
Marine Fuels & Bunker Market
Marine fuel prices saw marginal gains, reflecting higher crude values and increased bunkering demand across Fujairah, Singapore, and Rotterdam.
- VLSFO (Very Low Sulfur Fuel Oil) in Fujairah was priced around 610–620 USD/MT, up from 595–600 USD/MT last month.
- HSFO (High Sulfur Fuel Oil) also moved upward slightly, as demand from scrubber-equipped vessels remained stable.
Global marine fuel demand is expected to grow in Q2 as commercial shipping volumes increase post-Chinese New Year.New Paragraph
Summary Outlook
| Product | Trend (March 2025) | Key Influences |
|---|---|---|
| Crude Oil | ↗ Slight Rise | Geopolitical tension, OPEC+ signals |
| Naphtha | ↗ Recovering | Gasoline blending, East Asia cracker margins |
| LPG | ↘ Weak | High inventories, low heating/petchem demand |
| Methanol | ↘ Bearish | Oversupply, weak derivatives |
| Marine Fuels | ↗ Stable to Firm | Fuel oil demand recovery, freight stabilization |
Conclusion & Outlook
March 2025 concluded with a mixed yet cautiously optimistic tone across global fertilizer and petrochemical markets. While persistent logistical constraints, volatile freight rates, and regulatory shifts such as the EU’s CBAM mechanism continue to reshape trade dynamics, certain price stabilizations across nitrogen and phosphate markets suggest a gradual return to supply-demand equilibrium.
Key Takeaways from March 2025
- Urea prices stabilized globally, driven by subdued demand in India and Africa but supported by tighter Iranian supply and cost-push pressure from ammonia.
- Ammonia markets softened in the Middle East and Asia-Pacific amid lower spot demand and easing energy prices, while North African cargoes held steady.
- Phosphate fertilizers (DAP/MAP) showed mild gains in Europe and India, mainly due to Chinese export limitations and solid procurement from Morocco.
- Sulfur and sulfuric acid experienced upward movement, particularly in East Asia and the Persian Gulf, due to vigorous buying activity from China and Indonesia.
- Potash remained relatively flat, but with continued tightness in availability from Russia and Belarus, buyers may face pricing pressure in Q2.
- Petrochemicals such as LPG and methanol weakened, while naphtha and marine fuels began recovering on improved refinery throughput and shipping demand.
Regional Outlooks
| Region | Fertilizer Outlook (Q2 2025) | Risk Factors |
|---|---|---|
| Asia (India, China, Southeast Asia) | Stable urea demand expected; phosphate imports to rise | Export restrictions from China; delayed tenders in India |
| Middle East & Persian Gulf | Increased urea/ammonia output likely; sulfur export firm | Gas price fluctuations; Red Sea shipping bottlenecks |
| Africa (West & North) | Active NPK and urea procurement to continue | Infrastructure gaps, financing challenges |
| Europe | CBAM compliance driving greener imports; phosphate firm | Carbon-related import costs, weaker ag demand |
| Latin America (Brazil) | Phosphate & potash restocking ahead of peak season | Currency volatility, freight cost pressure |
Market Sentiment Heading into Q2 2025
As we move into the second quarter of 2025, the fertilizer market is expected to remain sensitive to energy prices, geopolitical risks, and evolving regulatory frameworks. However, there are signs of stabilization in the nitrogen complex and cautious optimism in the phosphate and sulfur segments. Stakeholders should:
- Monitor tender activity in India and other major markets that can rapidly shift pricing.
- Evaluate freight and insurance costs in regions facing bottlenecks (e.g., Red Sea, East Africa).
- Prepare for CBAM implementation, focusing more on carbon accounting, particularly for urea, ammonia, and nitrate-based fertilizers.
Final Notes
Green Gubre Group remains committed to supporting partners across the value chain with up-to-date market intelligence, reliable sourcing strategies, and sustainable supply chain solutions. Our March 2025 report reflects our ongoing dedication to transparency, strategy, and market responsiveness as we navigate this dynamic industry landscape together.
Let’s shape the future of global agriculture and petrochemical trade—efficiently, ethically, and sustainably.
References
- International Fertilizer Association (IFA) – Market Intelligence
- Profercy – Nitrogen, Ammonia, and Urea Market Reports
- Argus Media – Weekly Fertilizer and Petrochemical Insights
- CRU Group – Global Fertilizer and Commodity Market Analysis
- ICIS – Global Chemical & Fertilizer Price Reports
- S&P Global Commodity Insights – Ammonia and NPK Trends
- World Bank – Fertilizer and Freight Market Data
- European Commission – CBAM Regulatory Updates
- IFA – Fertilizer Statistics & Supply/Demand Forecasts
- IEA – Ammonia and Hydrogen Production Outlook